部分代码用法
ndarray数组采用的是广播式运算,即可以一个数组加减一组数组,示例如下:
1
2
3
| m = np.array([1,2,3])
n = np.array([[4,5,6],[7,8,9]])
m-n
|
结果如下:
1
2
| array([[-3, -3, -3],
[-6, -6, -6]])
|
对结果分别平方求和可用代码:
1
2
| x= np.sum((m-n)**2, axis=1)
x
|
结果如下:
1
| array([ 27, 108], dtype=int32)
|
KNN分类
1. 读取数据
1
2
| import numpy as np
import pandas as pd
|
1
2
3
4
5
6
7
8
9
10
11
12
13
14
15
16
17
18
19
20
21
22
23
24
|
data = pd.read_csv(r"iris.csv", header = 0)
data["Species"] = data["Species"].map({"versicolor": 0,"setosa": 1,"virginica": 2 })
data.drop("Unnamed: 0", axis=1,inplace=True)
data.drop_duplicates(inplace=True)
data["Species"].value_counts()
|
数据显示如下:
1
2
3
4
| 0 50
1 50
2 49
Name: Species, dtype: int64
|
2. 创建KNN对象
1
2
3
4
5
6
7
8
9
10
11
12
13
14
15
16
17
18
19
20
21
22
23
24
25
26
27
28
29
30
31
32
33
34
35
36
37
38
39
40
41
42
43
44
45
46
47
48
49
| class KNN:
"""用python语言实现K邻近算法"""
def __init__(self,k):
"""
初始化方法
k:int,邻居的个数
"""
self.k = k
def fit(self, X, y):
"""
训练方法
X:类数组类型,形状为:[样本数量,特征数量]
待训练的样本特征(属性)
y:类数组类型,形状为:[样本数量]
每个样本的目标值(标签)
"""
self.X = np.asarray(X)
self.y = np.asarray(y)
def predict(self, X):
"""
根据参数传递的样本,对样本数据进行预测
X:类数组类型,形状为:[样本数量,特征数量]
待训练的样本特征(属性)
result:数组类型
预测的结果
"""
X = np.asarray(X)
result = []
for x in X:
dis = np.sqrt(np.sum((x-self.X)**2, axis=1))
index = dis.argsort()
index = index[:self.k]
count = np.bincount(self.y[index])
result.append(count.argmax())
return np.asarray(result)
|
3. 训练和测试
1
2
3
4
5
6
7
8
9
10
11
12
13
14
15
16
17
18
19
20
21
22
23
24
25
26
27
28
29
30
31
32
33
|
t0 = data[data["Species"] == 0]
t1 = data[data["Species"] == 1]
t2 = data[data["Species"] == 2]
t0 = t0.sample(len(t0), random_state=0)
t1 = t1.sample(len(t1), random_state=0)
t2 = t2.sample(len(t2), random_state=0)
train_X = pd.concat([t0.iloc[:40, :-1], t1.iloc[:40, :-1], t2.iloc[:40, :-1]], axis=0)
train_y = pd.concat([t0.iloc[:40, -1], t1.iloc[:40, -1], t2.iloc[:40, -1]], axis=0)
test_X = pd.concat([t0.iloc[40:, :-1], t1.iloc[40:, :-1], t2.iloc[40:, :-1]], axis=0)
test_y = pd.concat([t0.iloc[40:, -1], t1.iloc[40:, -1], t2.iloc[40:, -1]], axis=0)
knn = KNN(k=3)
knn.fit(train_X, train_y)
result = knn.predict(test_X)
display(np.sum(result==test_y))
display(np.sum(result==test_y)/len(result))
|
结果如下:
1
2
3
4
5
6
7
8
9
10
11
12
13
14
15
16
17
18
19
20
21
22
23
24
25
26
27
28
29
30
31
32
| 28
0.9655172413793104
86 True
71 True
69 True
59 True
89 True
96 True
53 True
50 True
97 True
94 True
36 True
21 True
19 True
9 True
39 True
46 True
3 True
0 True
47 True
44 True
121 True
119 False
109 True
139 True
146 True
103 True
100 True
148 True
145 True
Name: Species, dtype: bool
|
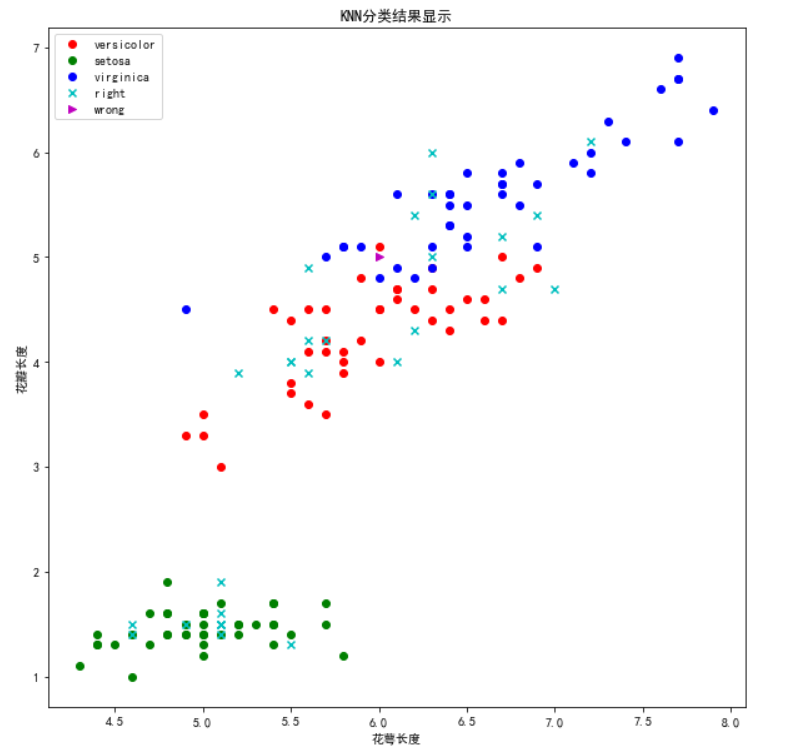
4. 可视化
1
2
| import matplotlib as mpl
import matplotlib.pyplot as plt
|
1
2
3
4
5
|
mpl.rcParams["font.family"] = "SimHei"
mpl.rcParams["axes.unicode_minus"] = False
|
1
2
3
4
5
6
7
8
9
10
11
12
13
14
15
16
17
18
|
plt.figure(figsize=(10,10))
plt.scatter(x=t0["Sepal.Length"][:40], y=t0["Petal.Length"][:40], color = "r", label = "versicolor")
plt.scatter(x=t1["Sepal.Length"][:40], y=t1["Petal.Length"][:40], color = "g", label = "setosa")
plt.scatter(x=t2["Sepal.Length"][:40], y=t2["Petal.Length"][:40], color = "b", label = "virginica")
right = test_X[result == test_y]
wrong = test_X[result != test_y]
plt.scatter(x=right["Sepal.Length"], y=right["Petal.Length"], color = "c", marker="x", label="right")
plt.scatter(x=wrong["Sepal.Length"], y=wrong["Petal.Length"], color = "m", marker=">", label="wrong")
plt.xlabel("花萼长度")
plt.ylabel("花瓣长度")
plt.title("KNN分类结果显示")
plt.legend(loc="best")
plt.show()
|


